🐛 Bug Details
View, edit, and collaborate on individual issues. The detail drawer brings together core fields, diagnostics, automated test scenarios, and the customer-facing panel in one side-by-side workspace.
🌟 Overview#
Click any issue on the 📋 Task Board to open the Bug Detail Drawer — a side panel that displays everything about a single bug, task, or feature request. The drawer is where your team collaborates: editing fields inline, adding comments with @mentions, uploading annotated screenshots, logging work, and reviewing the diagnostic data captured by the 💬 Feedback widget and the 🔌 Browser Extension .
Every change auto-saves and, when 🔗 Jira sync is active, propagates to the corresponding Jira ticket in real time. The full activity history provides a complete audit trail.

A standalone full-screen version is also available at /bug-view/:bugId — useful for sharing a link or embedding the bug view inside another tool (e.g., the 🧩 Sniffer for Jira panel). It supports ?embed=true to hide chrome.
🏷️ Header#
The drawer header shows:
📑 Tabs#
The detail drawer organizes information across up to four context-aware tabs. Tabs only appear when they have content to show — e.g., Diagnostics is hidden if the issue has no captured attachments, and Test Automation is hidden if no video recording is attached.
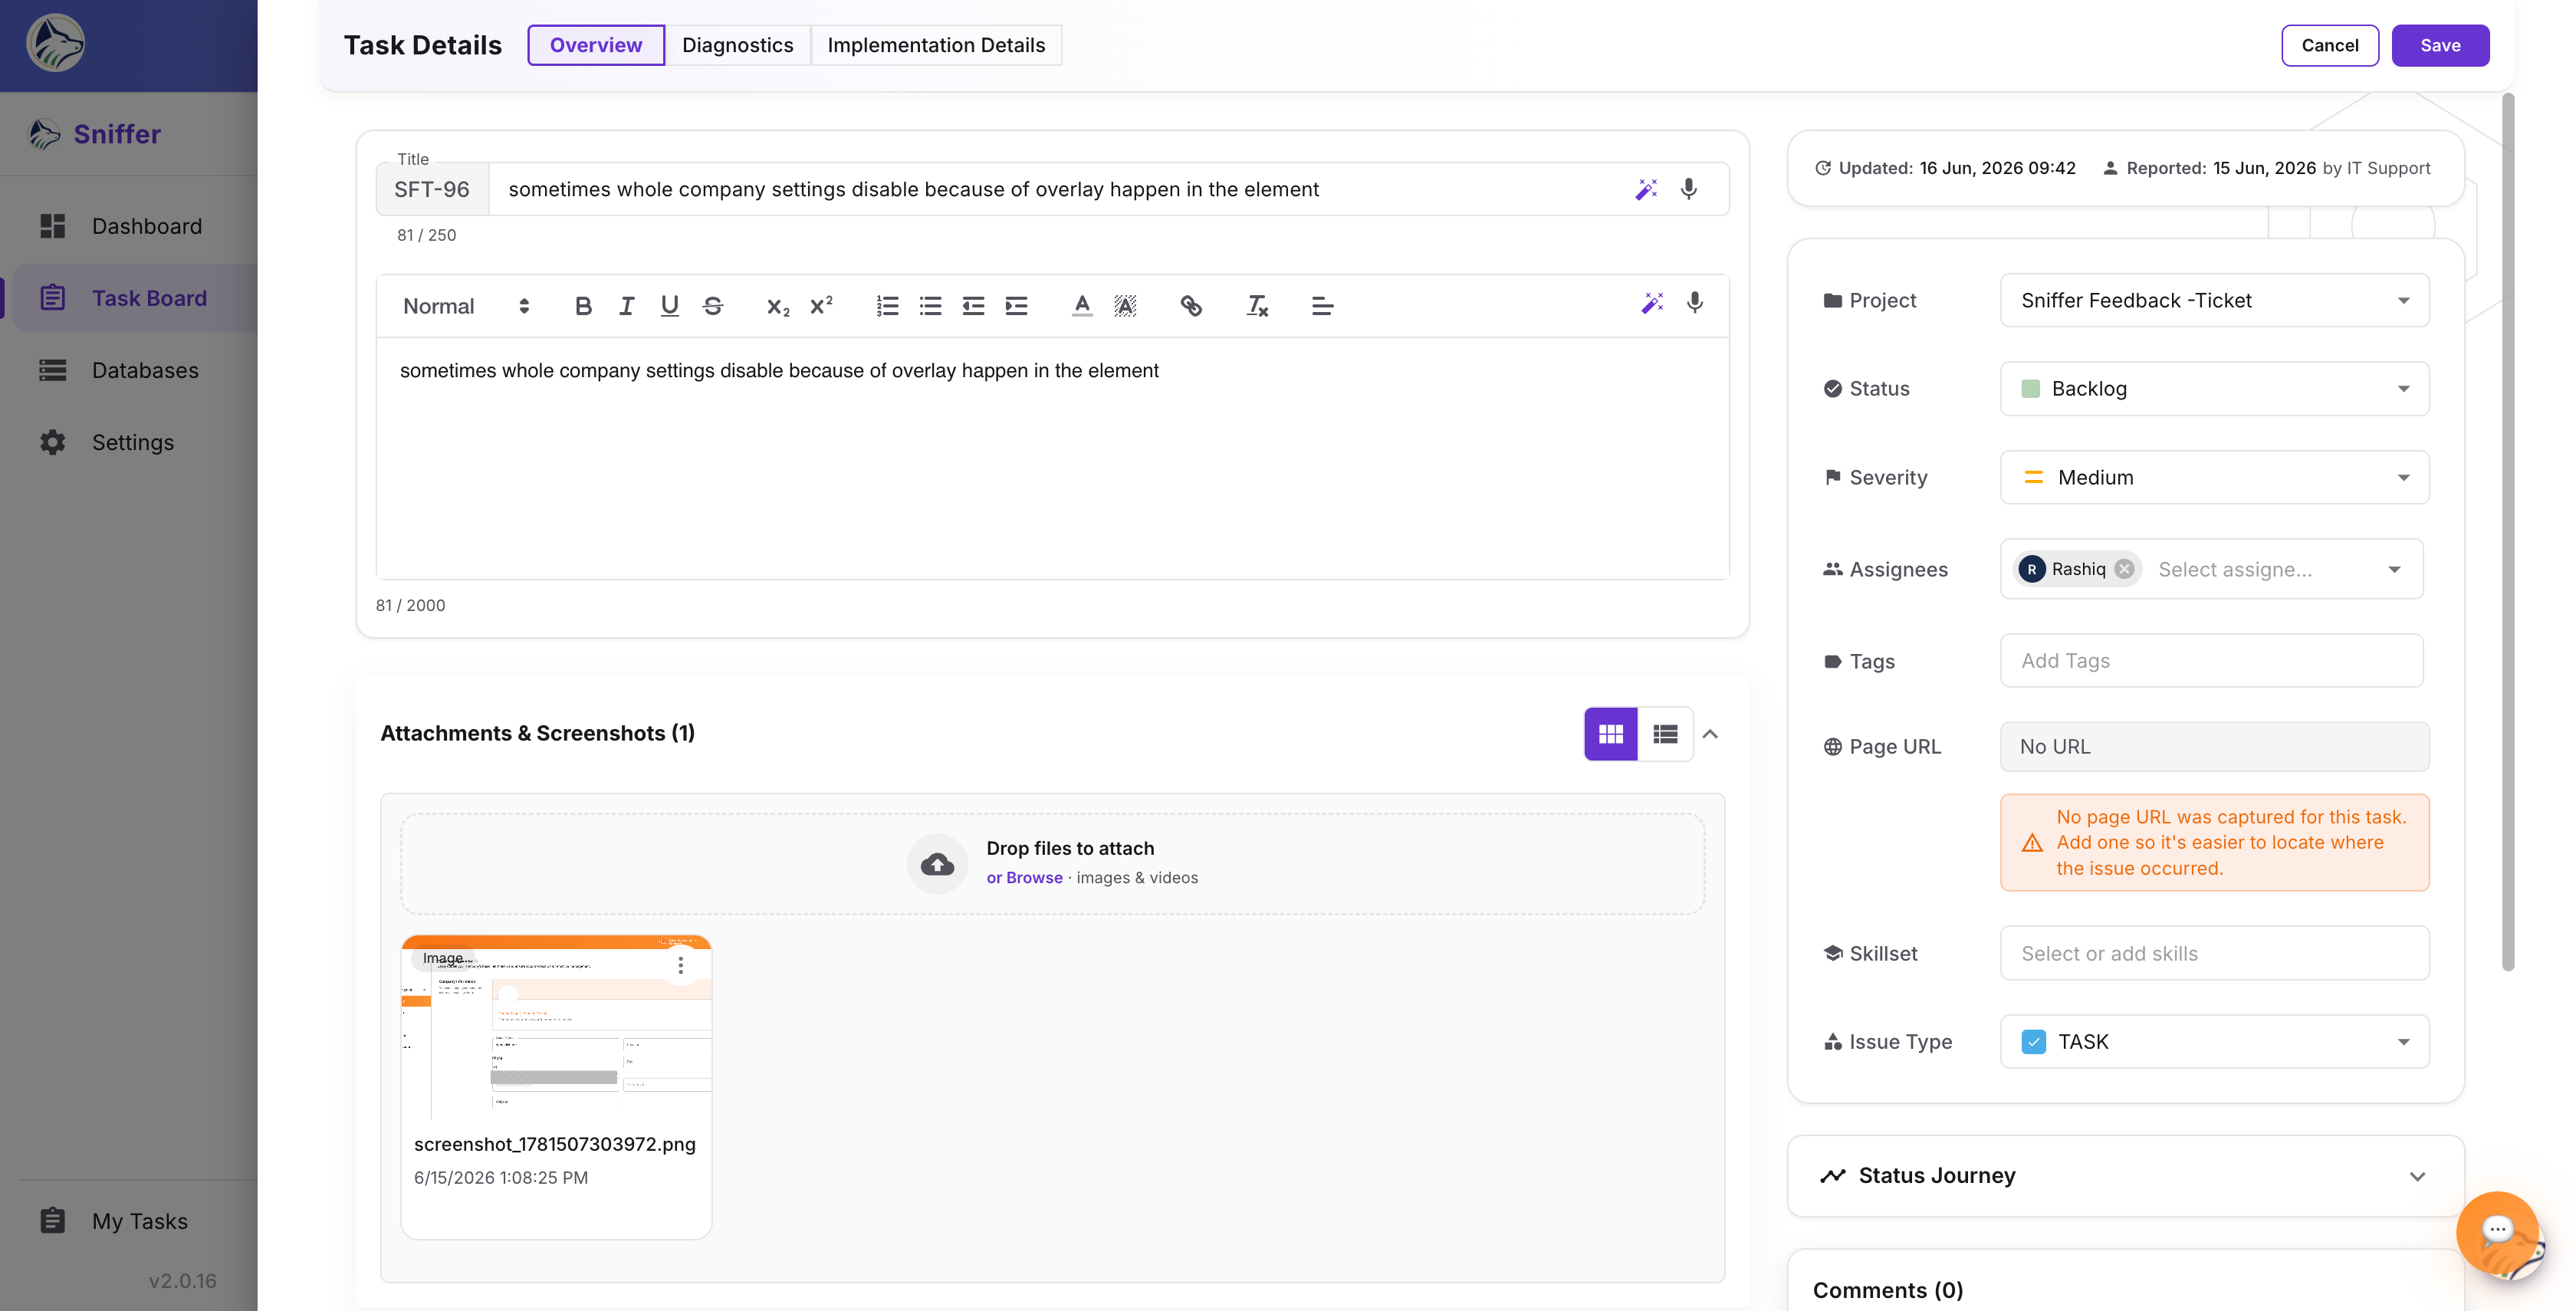
1. ℹ️ Overview#
The default tab. All core fields, editable inline:
Inside the Overview tab you’ll also find:
- 📎 Attachments panel — list / grid toggle, full-size image viewer with zoom & pan, video playback with timeline scrubber and speed control, the 🎨 annotation tool (draw, add text, shapes, choose colors, undo/redo), and download / delete actions. File limit: up to 25 MB per file.
- 💬 Comments panel — rich-text editor with @mentions, emoji, inline file attachments, edit / delete on your own comments, and threaded replies. Comments sync bidirectionally with Jira when comment sync is enabled in 🔗 Integrations .
- ⏱️ Work Logs — click ➕ Add Work Log to capture time spent, a description, the date, and the user. Estimation vs. actual time rolls up to 📊 Dashboard analytics .
- 📜 Activity history — chronological audit trail of every change, comment, status transition, assignment, and link, with timestamps and user attribution. Filterable by event type.
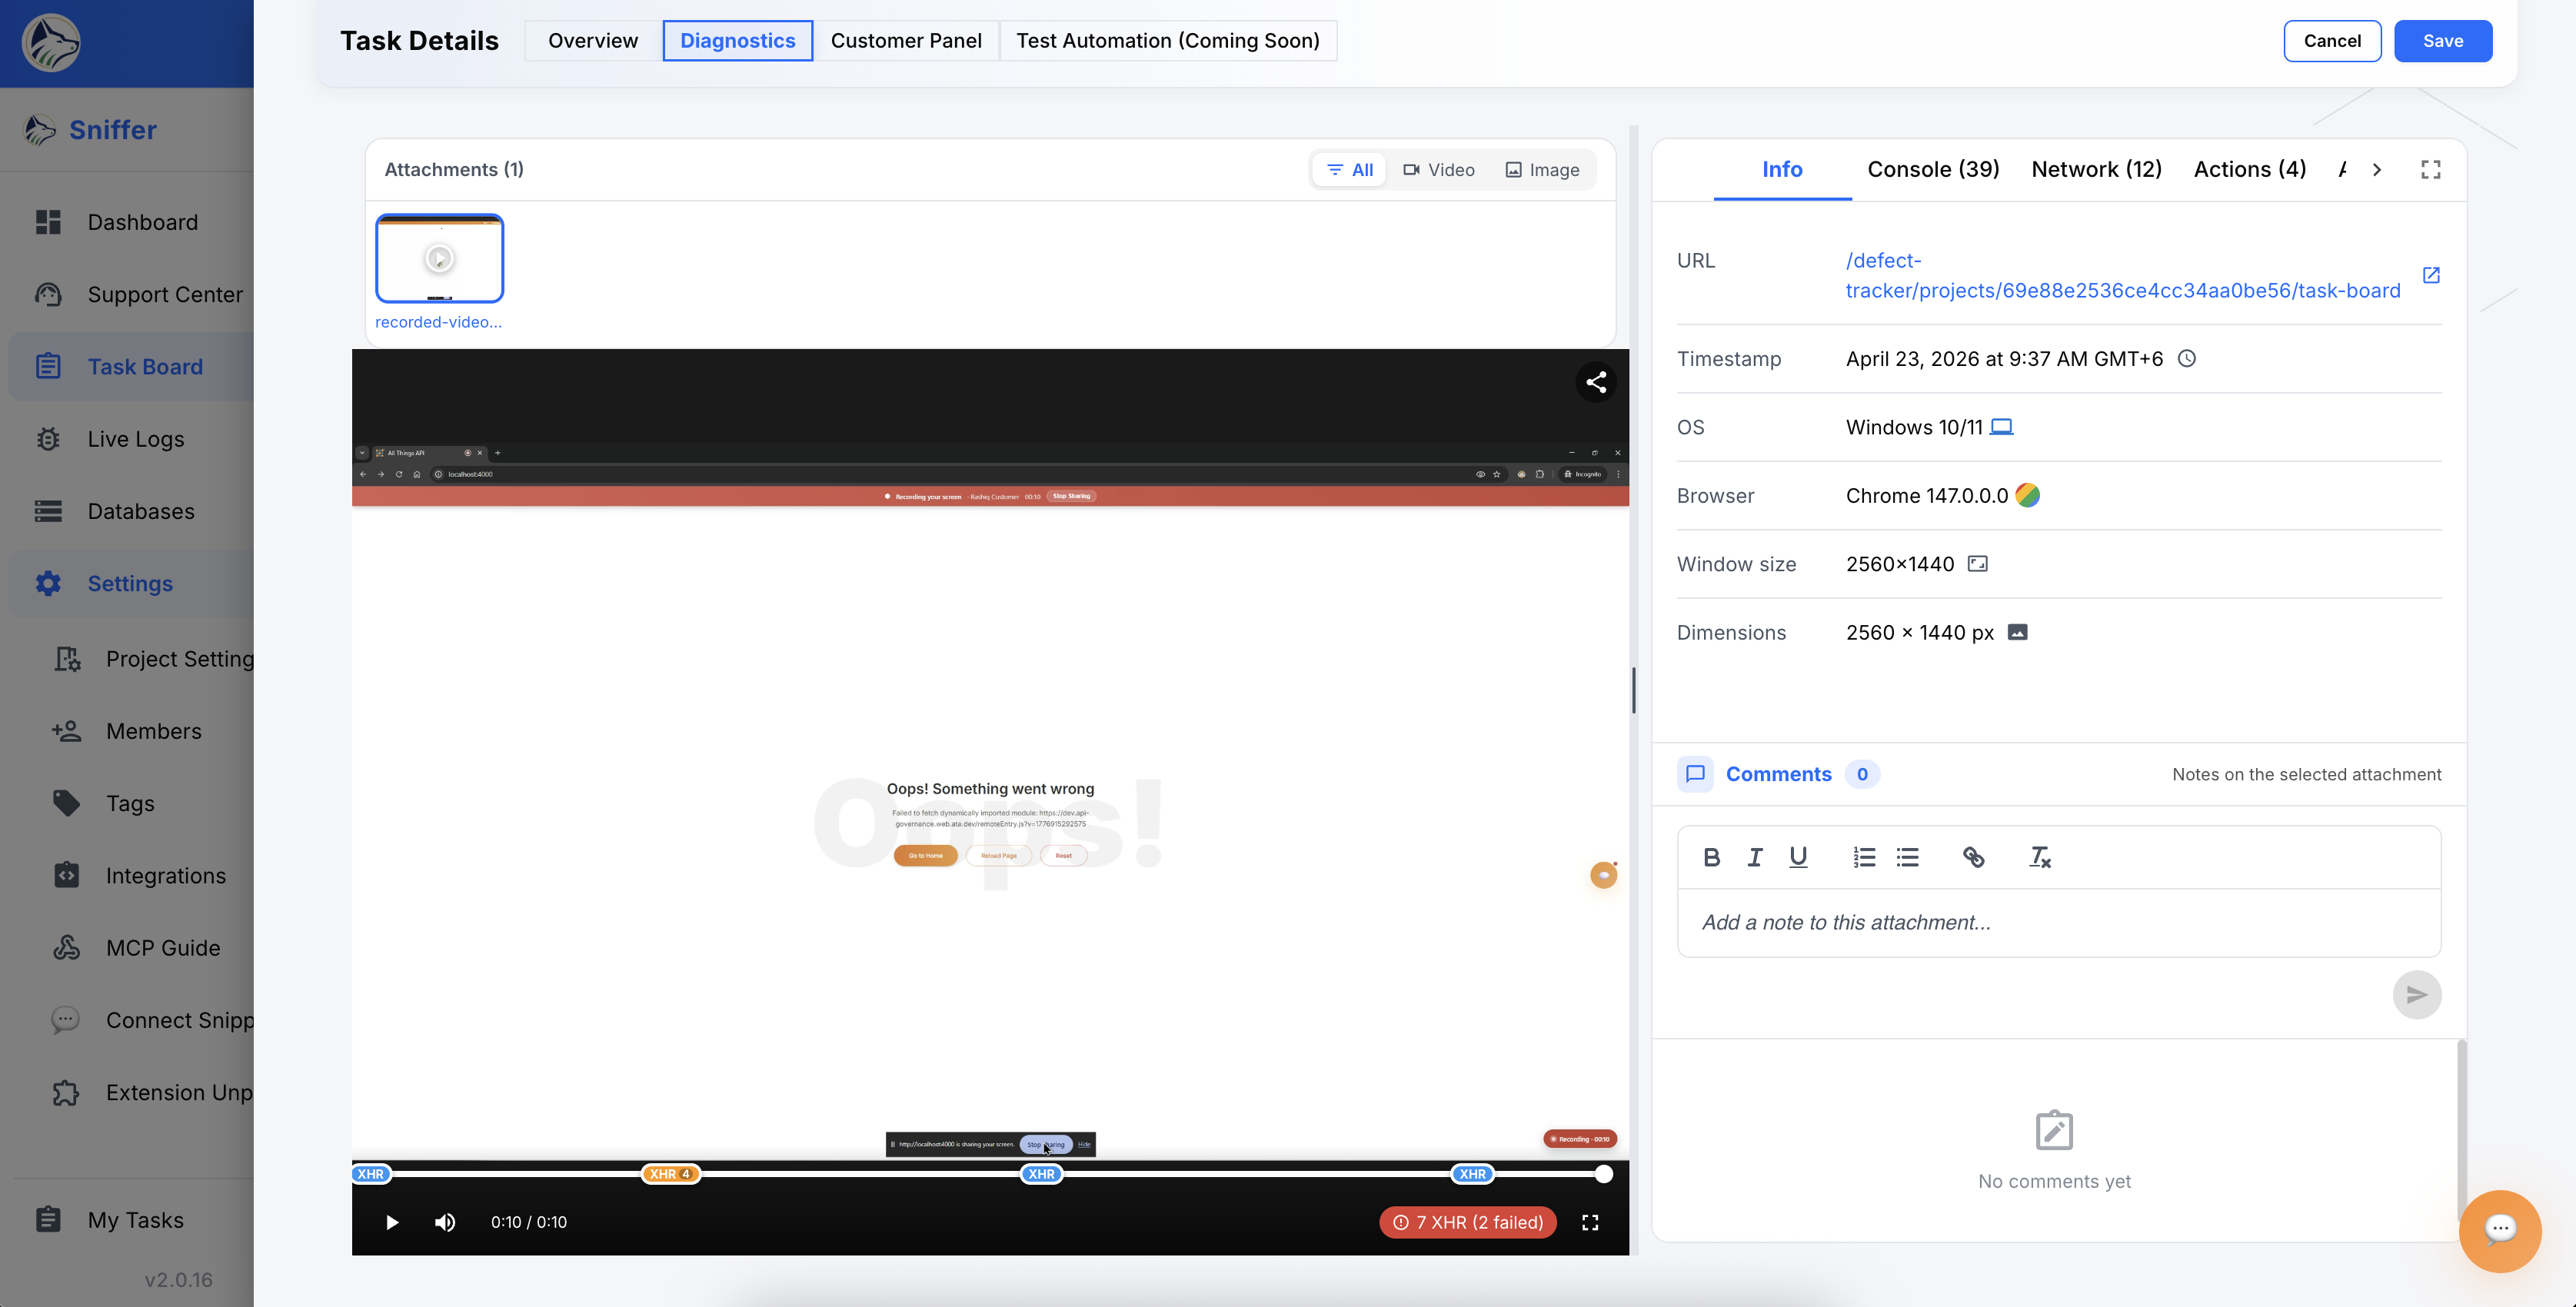
2. 🩺 Diagnostics#
Shown when the issue has captured attachments (screenshots, videos, console logs, network logs). The Diagnostics tab is the “what was happening on the user’s screen” view.
Screenshots, recordings, and logs captured via the 💬 Feedback Widget , 🔌 Browser Extension , 📡 Live Logs , or 🤖 Sniffer AutoBug land here automatically.
3. 🧪 Test Automation (Coming Soon)#
Shown when the issue has at least one video attachment. The Test Automation tab is a placeholder for generating a runnable UI test scenario from the recorded session.
4. 👥 Customer Panel#
Shown for non-EPIC issues. The Customer Panel is the customer-facing context — who reported it, which account they belong to, prior interactions, and any contact / triage actions you take from here are recorded against the bug.
✏️ Inline Editing#
All fields in the Overview tab are editable directly — click any field to modify it. Changes are:
- Auto-saved immediately (optimistic UI with rollback on error)
- Synced to Jira in real time (if integration is active)
- Logged in activity history with before/after values