Skip to Content
InsightsDashboard & Analytics

πŸ“Š Dashboard & Analytics

Visualize bug trends, monitor team performance, and leverage AI-powered analysis to identify defect patterns.


🌟 Overview#

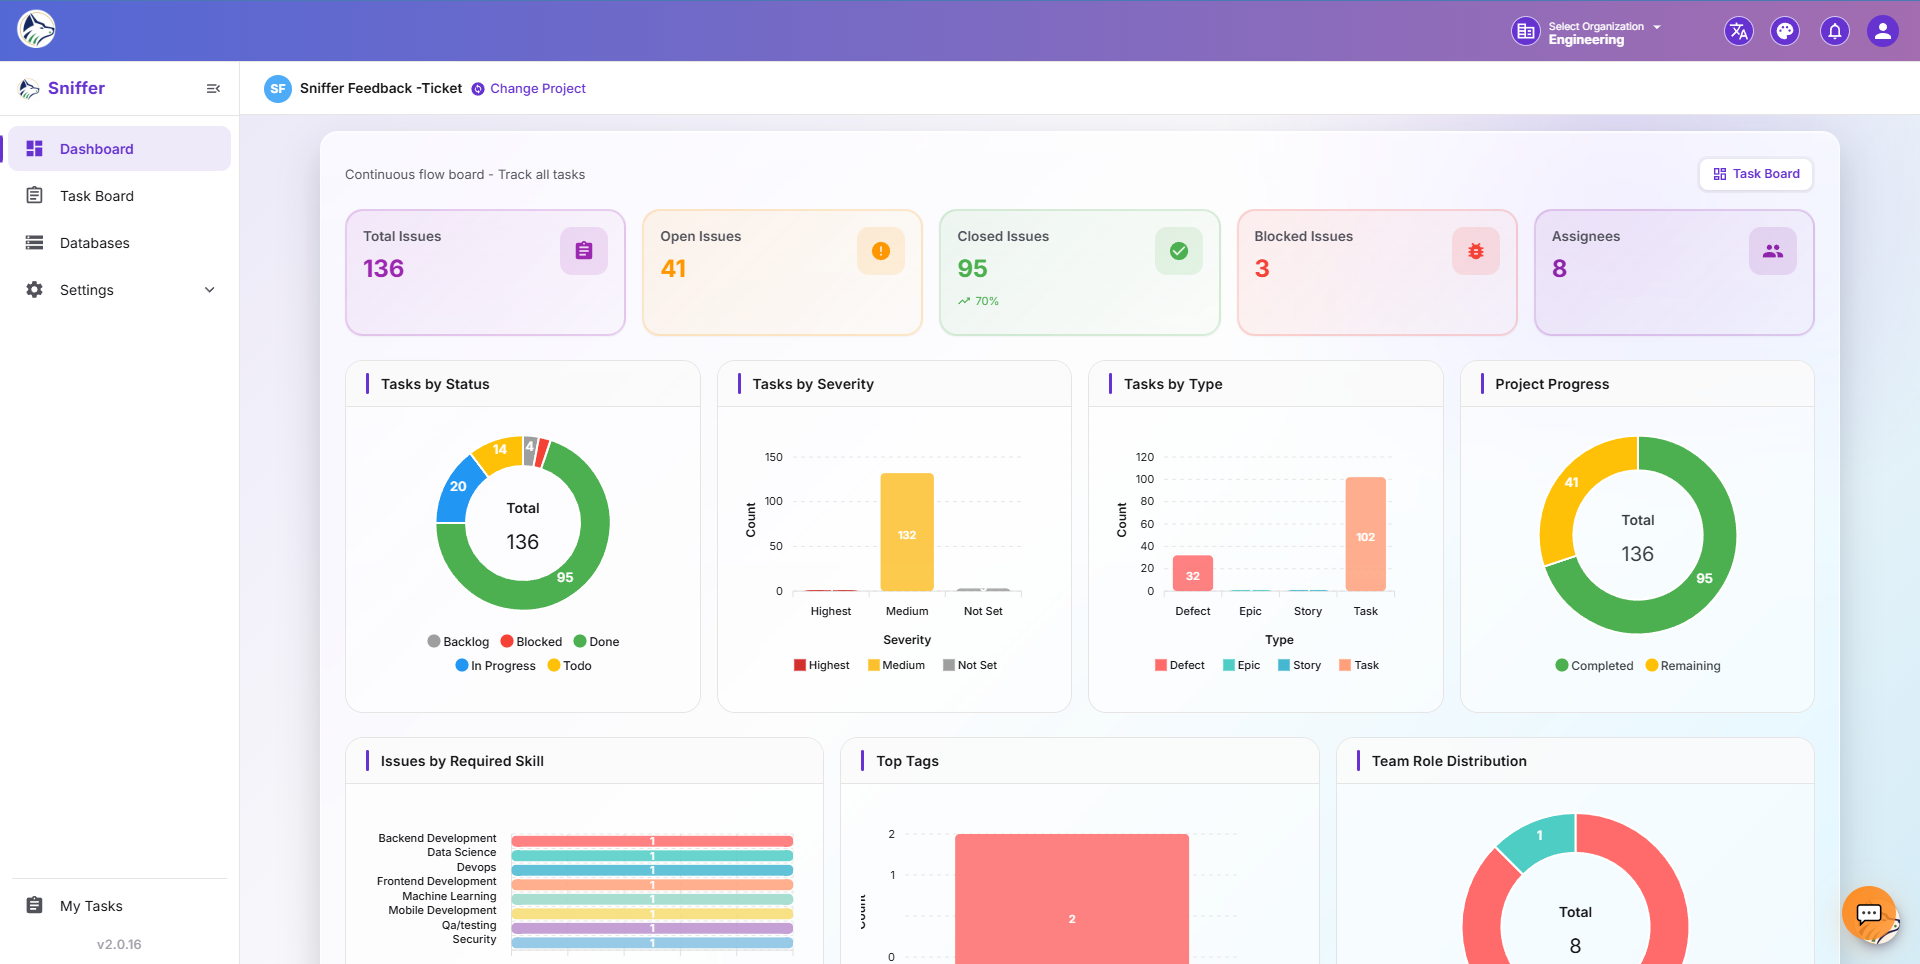
The Dashboard provides a real-time visual summary of your project’s health. It combines interactive charts (powered by ApexCharts), summary cards, and tabular data to give managers, team leads, and stakeholders a clear picture of defect trends and team capacity.

All data is filterable by date range, assignee, priority, severity, and tags. Charts are interactive β€” click any segment to drill down into the underlying issues. Data refreshes in real time via WebSocket.

Route: /sf/projects/:id/dashboard


🎚️ Global Filters#

A horizontal filter bar at the top of the dashboard applies to every chart simultaneously:

FilterOptions
Date RangeToday / 7d / 30d / 90d / Custom
AssigneeOne or many team members
PriorityHighest, High, Medium, Low
SeverityBlocker, Critical, Major, Minor, Trivial
TagsOne or many tags
TypeBug, Defect, Task, Story, Feature, Epic
SourceManual, Feedback, Live Log, Extension, Jira

πŸ“ˆ Summary Cards (KPIs)#

A row of metric cards at the top of the dashboard:

CardDescription
πŸ“‹ Total ItemsTotal bugs, tasks, and features in the date range
βœ… CompletedItems moved to Done or Closed
πŸ”„ In ProgressItems currently being worked on
🚫 BlockedItems in a blocked state
πŸ“₯ OpenItems not yet started
πŸ”΄ CriticalHigh-priority items needing immediate attention
⏰ OverdueItems past their due date
πŸ“‘ System BugsLive-log errors (count + trend arrow)

Each card shows the absolute value, a trend arrow vs. the previous period, and a sparkline.


πŸ“Š Charts & Visualizations#

πŸ“ˆ Bug Trend Over Time#

Line chart showing creation vs. resolution rate:

LineDescription
πŸ“ˆ CreatedNumber of bugs created per period
πŸ“‰ ResolvedNumber of bugs resolved per period
πŸ“Š Net ChangeGap between created and resolved

πŸ₯§ Status Distribution#

Pie/donut chart showing items across statuses β€” Todo, In Progress, In Review, Done, plus any custom statuses.

πŸ“Š Priority Distribution#

Bar chart showing how items distribute across priority levels β€” Critical πŸ”΄, High 🟠, Medium 🟑, Low 🟒.

⚠️ Severity Distribution#

Chart showing severity breakdown β€” Blocker, Critical, Major, Minor, Trivial.

🏷️ Type Summary#

Distribution of issue types β€” Bug, Task, Feature Request, Story, Epic.

🏷️ Tag Summary#

Most frequently used tags and their frequency counts.

🌐 Source Breakdown#

Donut chart showing where bugs come from β€” Manual, Feedback Widget, Live Logs, Extension, Jira, Sniffer AutoBug.


πŸ‘₯ Team Performance#

πŸ“Š Assignee Workload#

MetricDescription
Assigned ItemsNumber of items per team member
Completed ItemsItems finished per member
Active ItemsCurrently in-progress per member
Estimated vs. ActualCompare estimated time against actual time logged
Avg Resolution TimeAverage time from open β†’ done per member

πŸ€– AI Defect Analysis#

Trigger automated analysis to discover patterns in your defect data:

  1. Click πŸ”¬ Trigger Analysis on the Dashboard.
  2. The AI analyzes bug patterns, common areas, and recurring issues.
  3. View the report with actionable insights.

πŸ“‹ Analysis Outputs#

InsightDescription
πŸ” Recurring PatternsBugs that keep reappearing in the same area
πŸ“ HotspotsCode areas or modules with highest bug density
⏱️ Resolution TrendsHow resolution time changes over time
πŸ”— CorrelationRelated bugs that may share a root cause
πŸ“Š PredictionLikely future defect areas based on history
πŸ‘₯ Team StrengthsWhich teams resolve which issue types fastest

Tip: Dashboard-level AI insights complement the bug-level context exposed via the 🧩 Sniffer for Jira  panel.


πŸ“€ Exporting#

ActionDescription
πŸ“„ PDF ExportPrint-friendly PDF of the entire dashboard
πŸ“Š CSV ExportUnderlying chart data as CSV
πŸ”— Share LinkRead-only public URL (respects role permissions)
πŸ“… ScheduleEmail weekly/monthly dashboard digest to stakeholders

πŸ” Permissions#

ActionRequired Permission
πŸ“Š View dashboardDASHBOARD.VIEW
πŸ€– Trigger AI analysisDASHBOARD.VIEW + project AI enabled
πŸ“€ ExportDASHBOARD.VIEW

TopicDescription
πŸ“‹ Task Board β†’Β The issues that feed dashboard metrics
πŸ› Bug Details β†’Β The detail drawer opened from a row
πŸ“‘ Live Logs β†’Β Error frequency data in analytics
πŸ›°οΈ System Bugs β†’Β System-bug specific metrics
🧩 Sniffer for Jira β†’Bug context visible inside Jira

Β© 2026 Your Company